

For those who do forex trading every day with the help of technical analysis, one of the main obstacles to face is the false break of market supports or resistances.
The strategies that a forex trader can adopt are different, but the human mind often pushes us to anticipate the market thinking to have some pips advantage over others. This can lead to the wrong trade and capital losses.
The most widespread and effective strategy is the one based on the opening of a trade in the moment in which supports and/or resistances already established in the trading plan as critical are stressed, always of course with confirmations of price in the closing phase of the chosen time frame, hourly for the aggressive trader, and daily for the most cautious one.
Here are some examples of real false breaks that would allow those who make forex trading to adopt the right measures. During 2013 EurUsd attempted to formalize one of the most classic reversal figures provided by the classical technical analysis: the head and shoulder ( FIGURE 1).
In the month of June 2016, EurUsd, after drawing the two shoulders and the head, experienced a sharp downtrend, with the target the so-called neck-line, or the line joining the middle points between shoulders and head. This neck line was passing through 1.2810 and on July 9th during the intraday the market dropped to 1.2755 before closing at 1.2785, in fact, a classic false break.
At this point, the wisest choice was to place a short order on the next day for EurUsd a few pips below the low of the previous day (1.2755), trying to prevent too heavy capital losses thanks to the effect of the false break.
That movement was cataloged just as a false break because, the next day, not only the market fell below 1.2755, but it even formalized a long white reversal candlestick known as a bullish engulfing pattern.
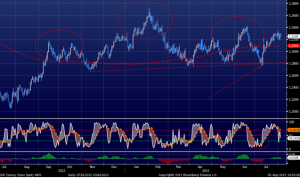
Figure 1
The major cases of frustration for those who do forex trading occur in a market trading range phase in which false signals are numerous, with several losses incurred as a result of the repeated stop-losses.
Let’s see another case.
AudUsd, between July 2012 and May 2013, was set in a horizontal channel with tops and lows that were solicited on several occasions, but did not create the conditions for a trend reversal. Every trader knows that a major movement outside of this rectangle would represent a technical break not to be underestimated, but what is the best time to enter? Look at the numerous cases in which the market has tried to fall below the low 1.0167of September 6th.
The first attempt in October had deceived, but the next day, there was the denial of the market. The same happened in March 2013, an intraday low below the support, but a closure above that was denying the break. Finally here is the decisive moment: on May 7th and 8th two intraday lows without closure below the support, but then on May 9th the final breakthrough.
The more aggressive trader could place a short already in the previous two days below the intraday low of those days, while the most conservative could go below the low of the candle that has in fact confirmed the break. Both them would have been right because the bear market has started from that moment.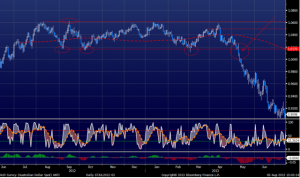
Figure 2


More Stories
What are cryptocurrency exchange-traded funds?
How to implement contrarian strategies?
Demo Account and The Choice of a Forex Broker