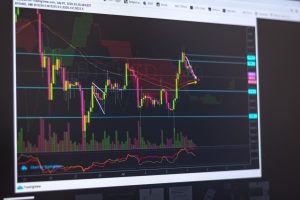
There are numerous distractive noises about trade prices on a price chart. The moving averages filter these noises, and you can monitor price trends more accurately by observing the direction of the moving average. An upward movement means an increase in the price, while a downward direction could indicate a fall in price.
Types of Moving Averages and How to Use Them
Simple Moving Average
This moving average is determined by the arithmetic price means of previous periods and the Exponential Moving Average (EMA), presented as a line. The longer the periods, the more remote the average will be from the price chart. For this reason, traders use smaller moving averages as an entry trigger and longer averages as trend filters.
Simple Moving Average (SMA) is rarely used alone. It is often used with other additional indicators. Despite this, there are a few strategies that you could employ using SMA only. For instance, you could use the sweet chariot strategy for an optimum time frame of one week or one day for short or medium-term trading.
The bigger time frames give you a more accurate price trend than short-term frames like one or four hours.
There are two rules you have to keep in mind when trading with this strategy:
- Firstly, if the moving averages take on an upward direction and the candle is closed above the moving average, it is best to buy when the next bar opens.
- Secondly, if the moving averages take on a downward direction the candle is closed below the moving average, then know it is time to sell.
The sweet chariot strategy is quite ancient. Its traditional version uses no oscillators. However, if you want to use it, you could add other trading tools like the Average Direct Movement Index (ADX) to improve the efficiency of the SMA. To avoid or minimize the chances of entering the flat market, it is always good to use a filter.
Exponential Moving Average
The difference between the exponential moving average (EMA) and the SMA is that the EMA gives more weight to the last data when determining the MA at each selected point. Additionally, the EMA formula is more complex than the SMA’s. The 10-period EMA gives most weight to the 9th price value, and hence the closing value of the 10th candle, when the order is reversed, has no effect.
The EMA facilitates a smoother transition between time frames. It resolves the shortcomings of the SMA in which a dropping the last price affects the indicator by reducing the weight of the price values as they move away from the MA. Although the EMA and SMA settings are similar, the moving average method used in the EMA in the indicator window is exponential.
Like the SMA, the EMA works best when it is combined with a good oscillator strategy. Combining a trend indicator with an oscillator enables you to find the most opportune moment to enter the market.
The EMA trading tool is suitable for any time frame; however, it works best when trading with M15-H1 charts in the short term.
Linearly Weighted Moving Average
This type of moving average is quite similar to the EMA. It gives more weight to the latest price value and is set identical to the previous ones. However, unlike the EMA and SMA, it is determined through geometric rather than arithmetic series.
Some of the trading strategies that use the Linear weighted Moving Average (LWMA) are the Relative Strength Index and the Moving Average Convergence Divergence. The WMA trading tool is ideal for medium-term trading with a daily chart with the Euro and the US dollar as the most favorable asset to trade.
The LWMA’s parameter allows you to specify the number of periods over which the indicator should be calculated. The values range from 2-1000, but the default value is 14. If the number is small, the market noise will be less. The LWMA also reacts faster to market price changes when you use a smaller value.
The LWMA, too, is best used for short-term trading because using larger values makes the line move away from the market price bar, allows more market noises, and produces more lagging on the market price.
You can use moving averages for any time frame, depending on the type of trader you are. If you spend a lot of time monitoring the trends on charts, you could consider using 15 minutes or hourly charts. If you have less time to observe the trends you could consider using daily charts.


More Stories
What are cryptocurrency exchange-traded funds?
The following are ten FTSE 100 travel stocks that may take flight in 2022
Investing in bond ladder ETFs